Featured · Technical write-up
Behavioral danger scoring from overhead highway video
An end-to-end system that watches highway traffic from overhead video — drone footage or research datasets — tracks every vehicle, and scores each driver's behavior in real time on a 0–100 Danger Index. The goal is to surface the drivers who are genuinely endangering the people around them (tailgaters, weavers, aggressive cut-ins) rather than crude proxies like raw speed, and to do it in a way that is evaluated against human judgment and explainable signal by signal.
At a glance
- Scope: the full pipeline from raw video to a live analyst dashboard — object detection, multi-object tracking, automatic metric calibration, behavioral scoring, incident detection, web UI, and an initial human-rater evaluation.
- Scale: ~25,000 lines of Python across ~125 modules, 286 commits, built solo in roughly three weeks.
- Human agreement: ~92% pooled agreement on held-out highD comparisons; 83.7% in a small real-footage study with six raters and roughly two dozen comparison pairs.
- Speed: scoring runs at ~2–4 ms per frame on a commodity CPU; the live tracker follows a video feed with a 1-second look-ahead and matches the offline reference tracker's leaderboard exactly.
- Discipline: every performance optimization was gated by a bit-identical equivalence check against the unoptimized output; every scoring change was checked against the human-rater results.
The problem
Traffic-safety analysis already uses established surrogate measures such as time-to-collision, time headway, speed, braking, and other kinematic indicators to characterize risky interactions. Individually, however, these measures capture only part of what a human observer considers when judging whether a driver is creating danger for surrounding traffic. This project explores whether overhead video can combine multiple surrogate measures and interaction-level behavioral signals into a continuous, explainable assessment of driving risk.
Overhead video (drones, pole cameras) can see this — every vehicle, every interaction, no instrumentation in the cars. The hard parts are (1) turning pixels into clean, physically-calibrated trajectories, (2) turning trajectories into a defensible danger measure, and (3) testing whether that measure bears a meaningful relationship to human judgments of dangerous driving. This project addresses all three.
What the system does
Two operating modes share one scoring engine:
Offline / research mode ingests the highD dataset — 60 drone recordings of German highways, ~110,000 vehicle trajectories — and replays it through the scorer, driving an interactive visualizer with score-colored bounding boxes, a clickable "hall of shame," and per-driver assessments.
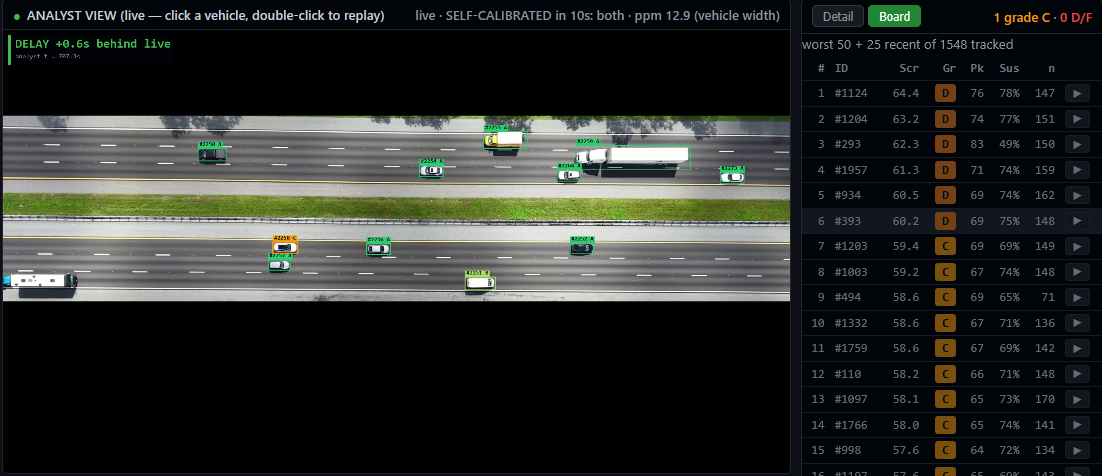
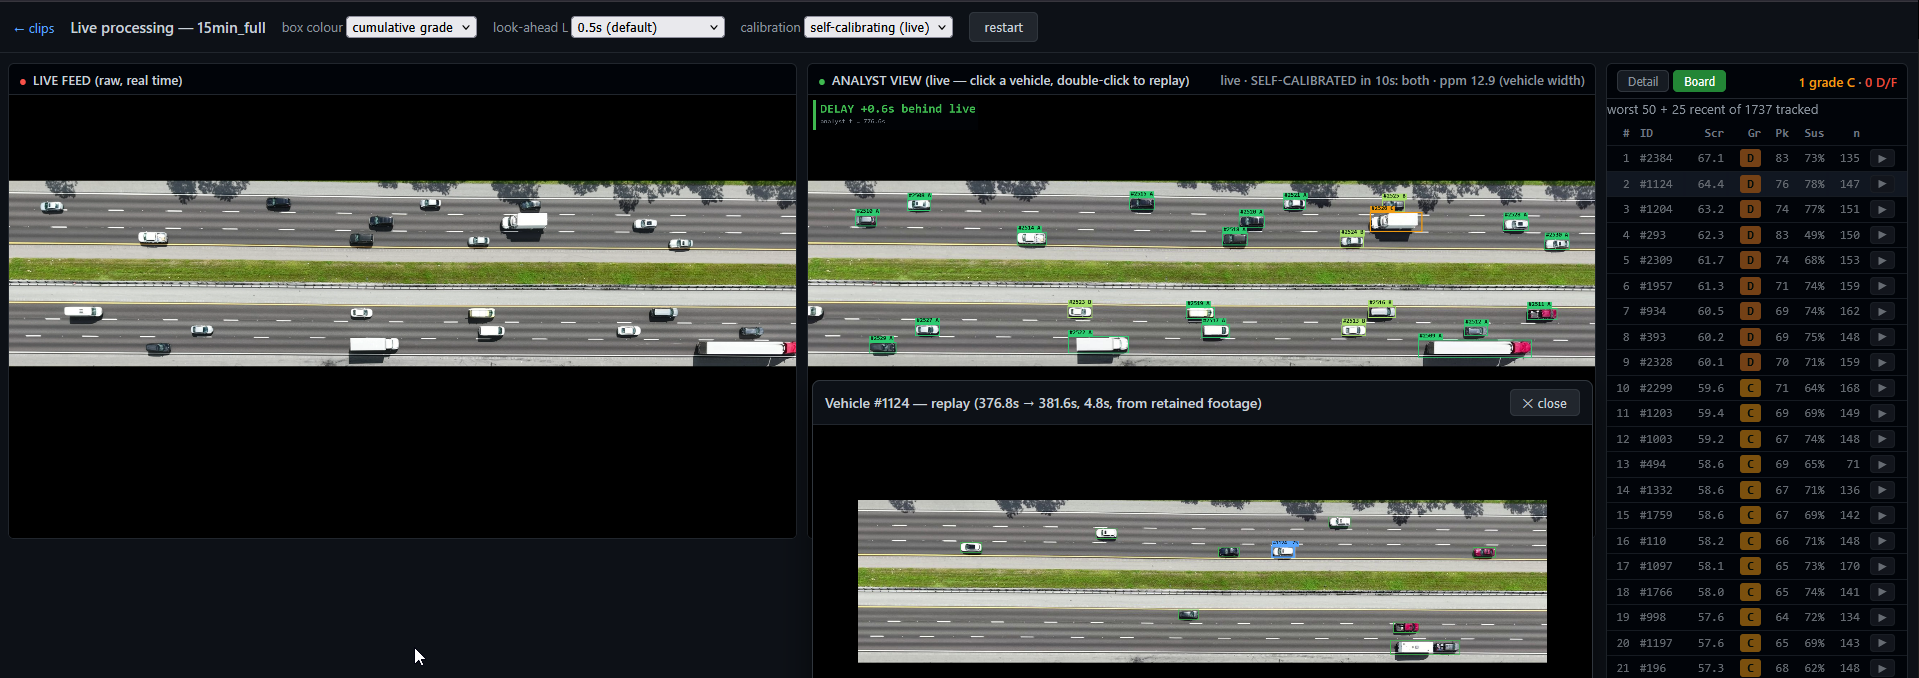
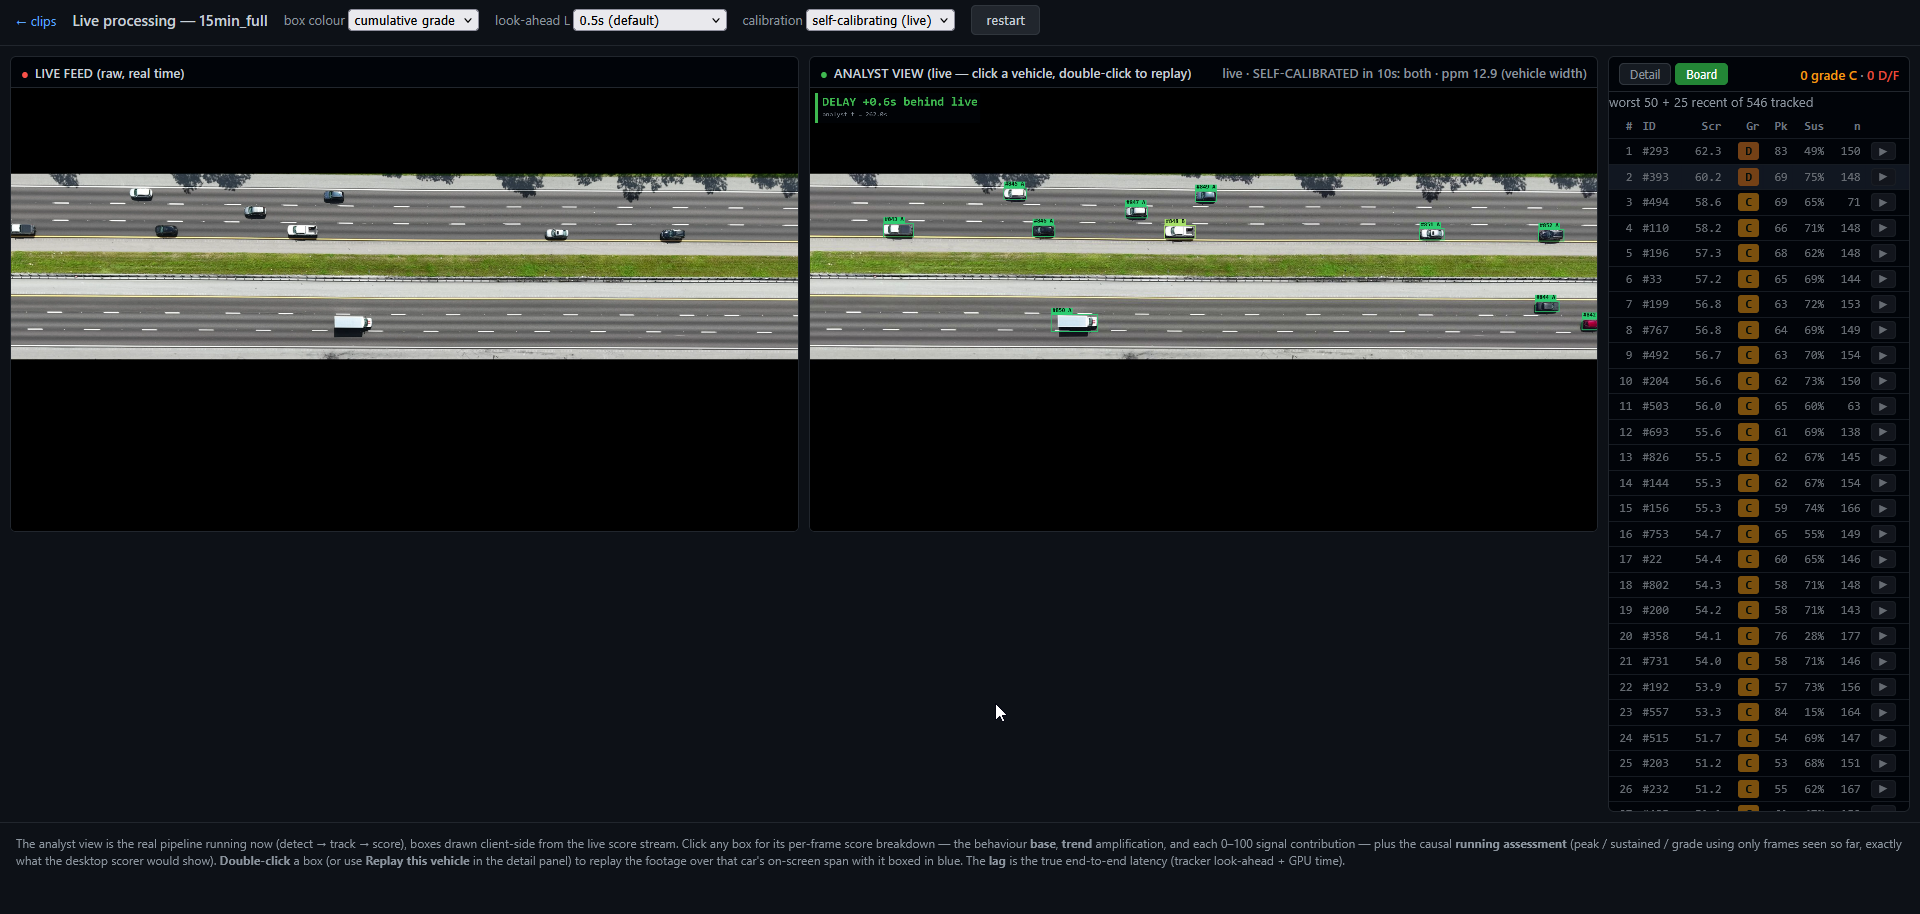
Live mode ingests raw drone video with no ground truth at all. The system detects vehicles, tracks them, calibrates itself (scale, road geometry, traffic direction — no manual setup), converts tracks into metric trajectories in the same format as the research dataset, and scores them in real time behind a web dashboard: live video with score overlays, a ranked driver board, and per-driver behavioral assessments with the evidence for each signal.
The scoring layer never knows which mode it is in. That is by design: the pipeline is structured so look-ahead is structurally impossible — the scorer's only input is a rolling 3-second buffer, so it behaves identically on recorded and live data, and its outputs are honest about what could have been known at that moment.
video ──▶ tiled detection ──▶ min-cost-flow tracking ──▶ self-calibration ──▶ metric trajectories
                                                                                    │
highD dataset ──────────────────────────────────────────────────────────────────────┤
                                                                                    ▼
                          frame simulator ──▶ rolling 3 s buffer ──▶ signal metrics
                                                                          ▼
                              noisy-OR scorer ──▶ Danger Index + per-driver assessment
                                                                          ▼
visualizers · live web dashboard · video export · CSV/NDJSON01Detection: seeing small vehicles in large frames
Drone frames are 1080p–4K and a car can be a few dozen pixels wide; naive full-frame detection downscales the image and erases exactly the vehicles you need. The detector here slices each frame into overlapping tiles at native resolution, runs a YOLOv8 network pretrained on the VisDrone aerial benchmark on each tile, maps boxes back to frame coordinates, and merges them with class-aware non-maximum suppression, plus one full-frame pass to catch large vehicles straddling tile seams. Everything is resolution-agnostic — the tile grid derives from the actual frame size at runtime.
Two problems needed custom work beyond the pretrained model:
- Articulated trucks. Off-the-shelf detectors see a semi as a flexing pair of "cab" and "trailer" boxes, which destroys tracking. I first solved this geometrically (a colinearity-gated box-merge in the tracker), then at the source: fine-tuned a dedicated whole-rig truck detector, distilling the geometric merger's outputs as training labels over the project's own footage. The fine-tuned model now runs as part of the canonical detector.
- Throughput. FP16 inference, TensorRT engine export, an automatic region-of-interest band, and cross-tile frame batching — each verified bit-identical to the unoptimized detector before adoption — plus a multi-process batch driver for whole-dataset runs.
02Tracking as global optimization
Rather than greedy frame-to-frame matching, tracking is formulated as a min-cost network-flow problem: every detection is a node, edges carry motion/appearance/gap costs, and the solver finds the globally optimal set of vehicle paths. Physical structure is encoded in the graph itself — vehicles cannot appear or vanish mid-road for free (a conservation prior with an explicit escape valve), and a velocity-continuity penalty is seeded by mutual-nearest-neighbor optical flow, which stays clean precisely in the ambiguous overtaking cases.
The solve uses Google OR-tools' C++ min-cost-flow solver — ~300× faster than the pure-Python network-simplex baseline (23 s → 0.08 s per clip) with verified-identical optimal cost, with a graceful fallback when OR-tools is absent.
The offline tracker is the reference. For live operation I built a rolling-window variant that re-solves a bounded sub-graph as frames arrive with a 1-second look-ahead, reusing feed-time caches so the per-frame step cost stays flat. Acceptance against the offline reference was explicit and measured: mean score divergence ≤ 8 points and 95th-percentile ≤ 30 on the 0–100 scale, and zero flips in the ranked driver board across the test fleet.
A guiding principle throughout: lose a track cleanly rather than recover it wrongly. A dropped track costs coverage; a wrong recovery silently corrupts every downstream safety metric.
03Self-calibration: no site setup
Scoring needs metric quantities (meters, m/s), but a drone feed arrives as raw pixels with unknown scale and orientation. The live system bootstraps its own geometry from the traffic it observes:
- Scale is estimated from lane geometry (k-means on lane-center spacing against standard lane widths) — median scale error 2.3% across a 49-clip sweep, with no manual calibration step.
- Traffic direction (left-to-right, right-to-left, or divided carriageways) is inferred from the detections themselves, with an opposite-carriageway statistical test to reject spurious splits.
- A deliberate scoping decision, informed by simulator experiments: don't chase absolute speed accuracy from uncalibrated video — calibrate spatial scale well, because the safety metrics that matter (headways, time-to-collision) only need relative geometry to be right.
04The scoring engine
The core measure is behavioral, built on surrogate safety measures from the traffic-safety literature — time headway (THW), time-to-collision (TTC), distance headway — plus interaction signals computed over each vehicle's rolling 3-second window: forcing others to brake, cutting in with insufficient gap, weaving, speed vs. surrounding flow (lane-aware), sustained jerk, lateral control variance, and more. Ten signals, each normalized 0–100 and individually explainable.
Design choices that turned out to matter:
- Noisy-OR aggregation, not a weighted average. With an average, one genuinely dangerous behavior gets diluted by the nine signals that don't apply. Noisy-OR lets the worst behavior set a floor while additional behaviors compound with diminishing returns; correlation dampening prevents double-counting related signals.
- Causal context gating. Braking hard because the car ahead braked is defense, not aggression — follower signals are conditioned on what the leader did. This single idea eliminated the largest class of false positives.
- Escalation as a separate channel. A trend detector measures how sharply a driver's danger is rising against their own baseline and amplifies the score multiplicatively (bounded) — it strengthens genuine worsening but cannot manufacture an alert from a calm baseline. An onset gate keeps routine lane changes from tripping it.
- Acute vs. chronic split. The Danger Index is a chronic disposition measure (smoothed, sustained). A separate incident detector (TTC + deceleration-rate criteria) catches acute conflict events and grades their severity by physical consequence, so a near-miss at highway speed outranks a parking-lot fender-bender.
- Honest scoping. Dense stop-and-go traffic is explicitly out of scope — in a jam, everyone's headway collapses by necessity, so margin-based signals saturate. Cutting that regime (and rejecting the NGSIM dataset entirely after data-quality review) was a deliberate decision rather than an accident of tuning.
Thresholds (Watch at 50, Critical at 80) are set on the index itself — not to an alert budget, a separation I kept deliberate: operational filters (such as top-k review) layer on top of the index rather than distorting it. Whether 80 is the right place for Critical is still an open question; see what's next below.
Danger Index — Watch and Critical thresholds
50 Critical
80 100
05Live operation
The live stack is a working analyst tool, not a demo script:
- A warm GPU worker pool keeps detector processes hot between clips; a binary streaming protocol feeds the browser.
- The dashboard survives real-world failure modes: explicit end/error records and warm-up heartbeats (no silently dead feeds), an epoch guard against stale streams, per-track pruning, and HTTP range-compliant video serving.
- The ranked assessment board was rebuilt around a single running accumulator — 62 ms → 0.35 ms per update with 30,000 tracked drivers, output-identical.
- A replay mode re-serves any cached run through the same UI for after-the-fact review.
06Validation: initial comparison with human judgment
The current evidence asks a narrower question: does the score's relative ordering broadly agree with human judgments of dangerous driving? This is an initial human-rater evaluation, not an independent validation of the Danger Index.
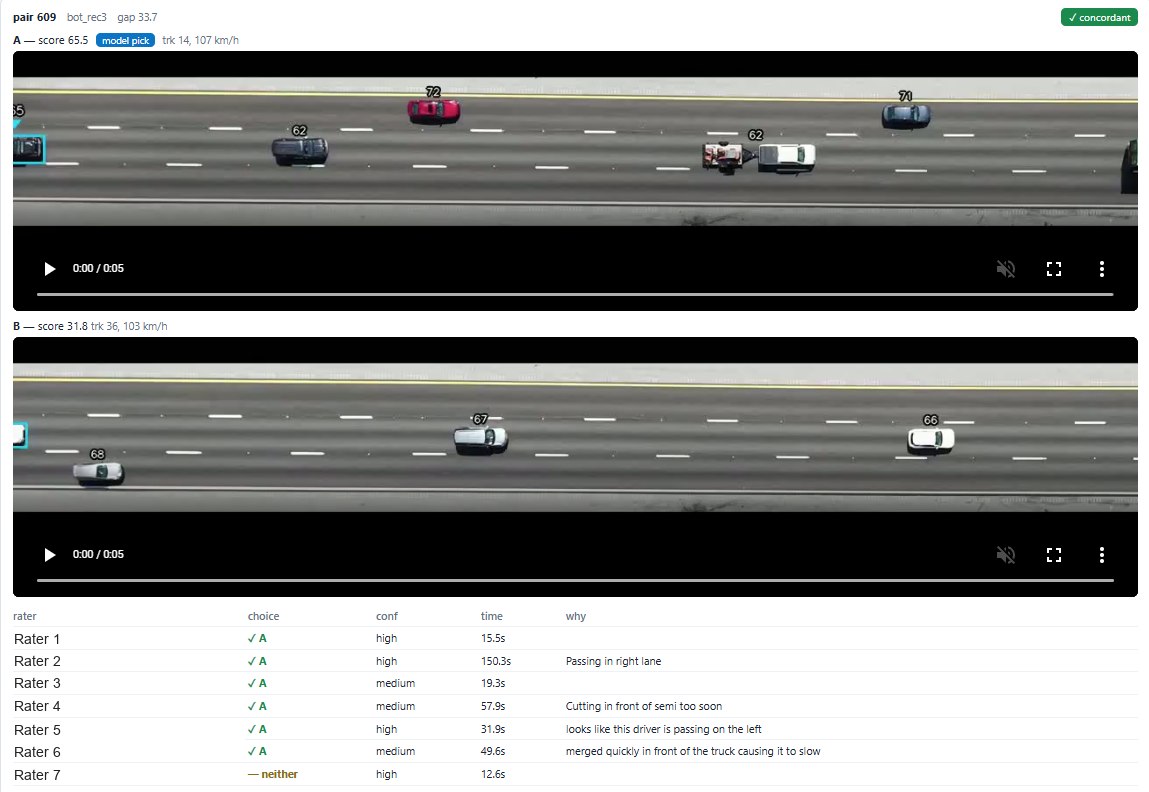
- Method. Raters reviewed pairs of vehicle clips blind to system scores and selected the more dangerous driver; "both" and "neither" were also available. Agreement was compared with score ordering, testing relative ranking without asking raters to reproduce a 0–100 scale.
- highD holdout: ~92% pooled human–system agreement on comparisons where the score difference was ≥ 15 points, using recordings not used during development. This is evidence of alignment in the sampled cases, not general validity.
- Real drone footage: six raters evaluating roughly two dozen comparison pairs produced 83.7% pooled agreement (72 of 86 judgments) on clips from the full CV pipeline. The small rater pool and limited sites make this an encouraging initial check rather than broad validation.
- Lead time: in held-out conflict events, the score was elevated above the driver's baseline before 81% of events; with proximity information ablated, the remaining signals anticipated ~65%. This suggests the score is not simply re-detecting closeness, but the event analysis is limited and is not independent outcome validation.
- Negative results kept. A THW rework that did not improve human agreement was shelved. Differences among raters also suggest that "dangerous" is not a single universal rubric, reinforcing the need to define the validation target and study design more carefully.
07Performance engineering
All hot paths were profiled before touching, and every optimization landed only after an equivalence-diff check — outputs compared element-for-element against the pre-change implementation.
| Component | Result | Verification |
|---|---|---|
| Scoring engine (dense traffic, CPU) | ~2–4 ms/frame — real-time at 25 fps with ~10× headroom | output-identical |
| Track association + smoothing | 25.9 → 6.9 ms/frame (~3.7×) via cached medians, vectorized smoothing, cached solve-graph assembly | bit-identical |
| Flow solve | 23 s → 0.08 s per clip (~300×) via OR-tools C++ solver | identical optimal cost |
| Detection stage | FP16 + TensorRT + auto-ROI + tile batching; parallel batch driver | bit-identical |
| Live assessment board | 62 → 0.35 ms per update at 30k drivers | output-identical |
| Live vs. offline tracker | mean Δ ≤ 8 pts, p95 ≤ 30, zero leaderboard flips | measured acceptance criteria |
Two profiling results went the other way: GPU acceleration of the scorer was evaluated and rejected (the workload is many small windows, not big tensors — the win came from prefix sums and algorithmic complexity instead), and warm-starting the flow solver was refuted by profile (the C++ solve was only ~9% of step time; the assumed bottleneck wasn't the bottleneck).
08Engineering practices
- Causality by construction. The scorer physically cannot see the future — its only data source is the rolling buffer. Live/recorded parity is an architectural property, not a test assertion.
- Frame-rate independence. Every temporal constant is defined in seconds and converted per-recording, so 25 fps research data and arbitrary-fps drone video share one code path.
- Experiment harness. 70+ standalone probe scripts (ablations, threshold sweeps, calibration checks, incident scans) accumulated as a first-class part of the repo — every tuning decision has a runnable receipt.
- Unit tests on synthetic fixtures for the core (buffer, metrics, scorer, pairing, incidents, calibration bootstrap, worker pool) that run without any dataset present.
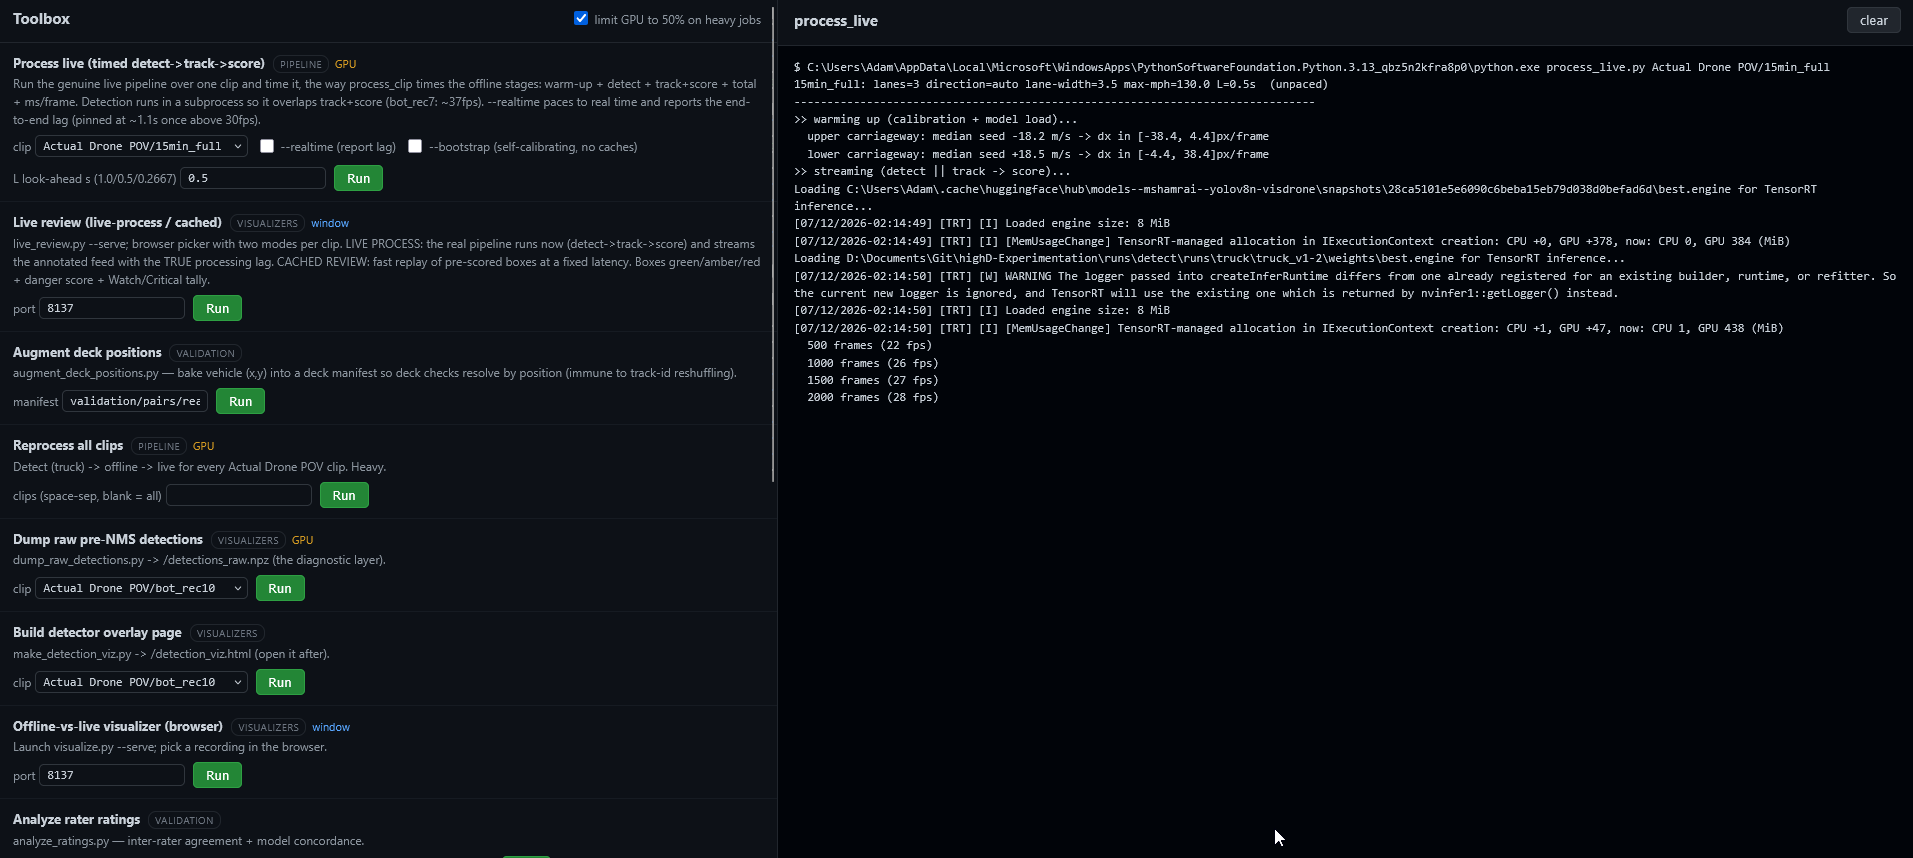
- Operational tooling. Every script registers in a point-and-click toolbox GUI — the rule being that a tool isn't finished until someone who isn't me can launch it.
09Beyond the code
- Intellectual property: a provisional patent application drafted and prepared for USPTO filing — full specification, 20 exemplary claims, and 10 figures generated programmatically from the actual pipeline, with the claim strategy informed by current §101 case law.
- Validation study design: pre-registered criteria, reproducible seeded deck draws, and a hosted rating site used by external raters.
10What's next
A pooled 83.7% from six raters over a two-dozen-pair deck is encouraging evidence, not proof — it measures agreement on ranking, over footage from a handful of sites. The gaps I consider real, and roughly the order I'd attack them:
- Validation that can test calibration, not just ordering. Forced-choice comparisons can show the score ranks drivers the way people do; they structurally cannot show that 80 is the right place for the Critical threshold. Testing that needs an absolute-judgment instrument or independent outcome-linked data (recorded incidents or other observed safety outcomes), a larger rater pool, and decks re-drawn against the current scorer.
- Weight profiles instead of one universal rubric. The rater who disagreed most wasn't wrong — they were scoring norm violations (speeding, weaving) while the system scores risk creation. Ablating the tailgating signal moved their agreement from 54% to 69% while collapsing another rater's from 100% to 45%, which says rubric differences are real and reweighting alone won't cover them: named, selectable weight profiles — with new signals where a rubric demands them — are the plan.
- A better reference for the speed-vs-flow signal. Today its "surrounding flow" is measured in a 2 m lateral band — effectively the driver's own car-following partner — so a speeder embedded in fast traffic drags the reference up and reads as compliant. A direction-wide reference fires 2–3× more often but pools across lanes and could misread a truck holding its lane's normal speed as chronically slow; the lane- and class-stratified breakdown needed to rule that confound out is the queued experiment.
- The stopped-vehicle blind spot. On the video path, the filter that correctly ignores parked and off-road vehicles currently also drops a vehicle stopped in a live lane before it reaches the scorer — precisely the event the stopped-in-lane signals were built to catch. The stationarity gate needs to learn the difference between "parked off-carriageway" and "stopped where traffic flows."
- Incident volume audit. The acute conflict detector surfaces fewer events on real footage than the traffic plausibly contains; checking its thresholds and gating against hand-labeled events is an open item.
- Geometry and domain breadth. Everything validated so far is straight multi-lane highway — the German research data plus a handful of local sites. Curved and angled roads need the auto-fit road model that is specced but not built, the articulated-truck fix still disagrees with the offline reference on two clips, and "works at a new site with zero re-tuning" is a design goal demonstrated on 49 clips, not a proven property of arbitrary sites.
None of these are hypothetical: they trace to open TODO items, shelved branches with written analyses, and plans already in the repo.
Development status
This is an independently developed research prototype. The implementation, experimental design, scoring decisions, acceptance criteria, and documented limitations are my own. The system remains under active development, particularly around validation and broader-domain testing.
Stack
Python · NumPy · OpenCV · PyTorch · Ultralytics YOLOv8 (VisDrone-pretrained + custom fine-tune) · TensorRT · Google OR-tools · SciPy / pandas / Matplotlib · stdlib HTTP server + vanilla-JS web UIs · highD dataset · BeamNG.drive (simulated drone footage for development) + real drone capture